Goals:
Credit: Materials by Sara Mathieson, modified from material created by Ameet Soni. Phoneme dataset and information created by Jessica Wu. Challenger dataset and visualization ideas from Alvin Grissom.
In this lab we will be analyzing two datasets:
phoneme dataset: The task of phoneme classification is to predict the label of a phoneme articulation given its corresponding voice signal. In this problem, we have voice signals from two different phonemes: “aa” (as in “bot”) and “ae” (as in “bat”). They are from an acoustic-phonetic corpus called TIMIT. Phoneme classification is an important part of a speech-to-text system.
Challenger dataset: on 1/28/86 the Challenger space shuttle exploded due to an O-ring failure. This dataset shows the results of previous O-ring experiments.
Accept your Lab 7 repository on GitHub classroom. You should have the following files:
data/ - directory containing train/test datasets. You may add additional datasets here.run_LR.py - your main program executable for Logistic Regression.LogisticRegression.py - file for the LogisticRegression class (and/or functions).README.md - for analysis questions and lab feedback.Your programs should take in the same command-line arguments as Lab 4 (feel free to reuse the argument parsing code), plus a parameter for the learning rate alpha. For example, to run Logistic Regression on the phoneme example:
python3 run_LR.py -r data/phoneme_train.csv -e data/phoneme_test.csv -a 0.02To simplify preprocessing, you may assume the following:
The datasets will have continuous features, and binary labels (0, 1). The train and test datasets will be in CSV form (comma separated values), with the label as the last column.
I would recommend creating a function to parse the CSV file format. Use the method split(',') to split the line (type string) into a list of strings, which can be parsed further.
Make sure the user enters a positive alpha value (it should be type float)
Your program should print the confusion matrix and accuracy of the result (see example below) for both the phoneme and Challenger datasets.
The design of your solution is largely up to you. You don’t necessarily need to have a class, but you should use good top-down design principles so that your code is readable. Having functions for the cost, for SGD, for the logistic function, etc. is a good idea.
You will implement the logistic regression task discussed in class for binary classification.
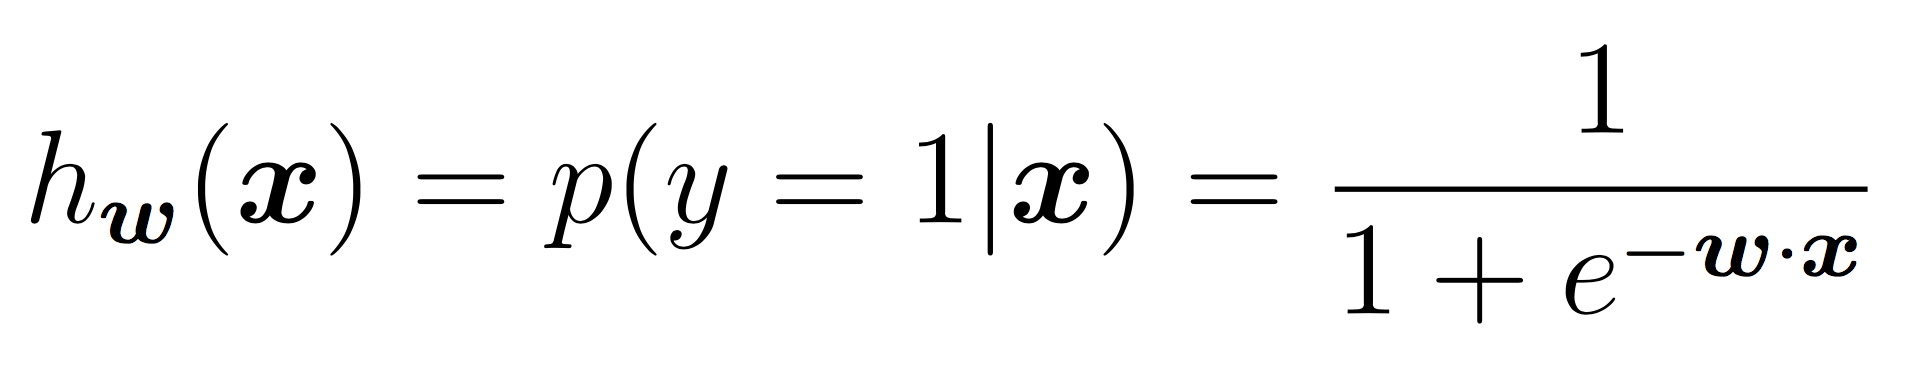
For now you should assume that the features will be continuous and the response will be a discrete, binary output. In the case of binary labels, the probability of a positive prediction is:
To model the intercept term, we will include a bias term. In practice, this is equivalent to adding a feature that is always “on”. For each instance in training and testing, append a 1 to the feature vector. Ensure that your logistic regression model has a weight for this feature that it can now learn in the same way it learns all other weights.
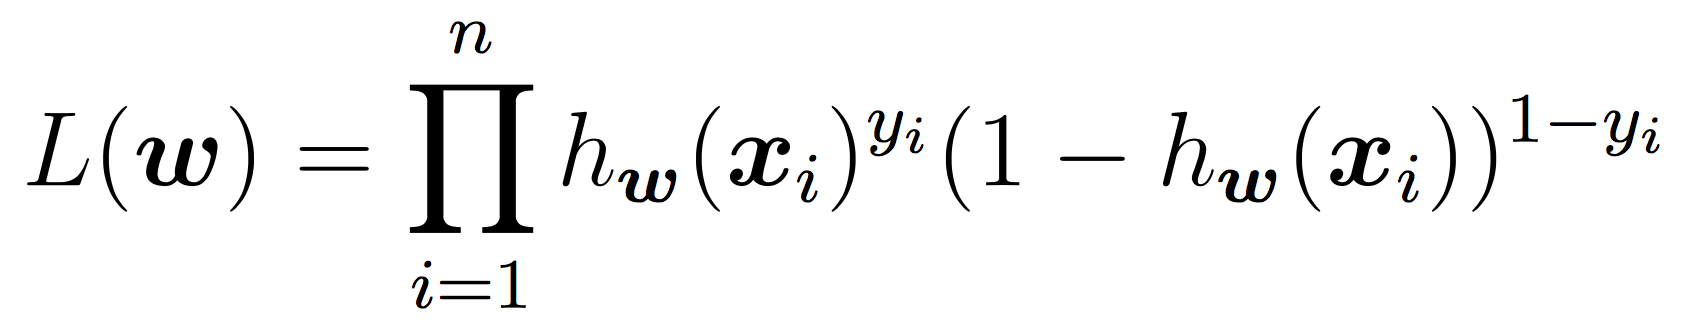
To learn the weights, you will apply stochastic gradient descent (SGD) as discussed in class until the cost function does not change in value (very much) for a given iteration. As a reminder, our cost function is the negative log of the likelihood function, which is:
Our goal is to minimize the cost using SGD. We will use the same idea as in Lab 3 for linear regression. Pseudocode:
initialize weights to 0's
while not converged:
    shuffle the training examples
    for each training example xi:
        calculate derivative of cost with respect to xi
        weights = weights - alpha*derivative
    compute and store current cost
The SGD updates for w term are:

The hyper-parameter alpha (learning rate) should be sent as a parameter to your SGD and used in training. A few notes for the above:
numpy.random.shuffle(A)which by default shuffles along the first axis. (You can instead shuffle the indices.)
The stopping criteria should be: a) a maximum of some number of iterations (your choice) OR b) the cost has changed by less than some number between two iterations (your choice).
Many of the operations above are on vectors. I recommend using numpy functions such as dot product to make the code simpler.
Try to choose hyper-parameters that maximize the testing accuracy.
For binary prediction, apply the equation:
and output the more likely binary outcome. You may use the Python math.exp() function to make the calculation in the denominator. Alternatively, you may use the weights directly as a decision boundary as discussed in class.
The choice of hyper-parameters will affect the results, but you should be able to obtain at least 90% accuracy on the testing data. Make sure to print a confusion matrix.
Here is an example run for testing purposes. You should be able to get a better result than this, but this will check if your algorithm is working. The details are:
alpha = 0.02epsilon = 1e-4 (see if cost has changed by this amount)$ python3 run_LR.py -r data/phoneme_train.csv -e data/phoneme_test.csv -a 0.02
Accuracy: 0.875000 (70 out of 80 correct)
prediction
0 1
------
0| 36 4
1| 6 34sklearnAfter implementing logistic regression by yourself, try using the LogisticRegression model implemented in the sklearn library. If you do not already have this library, install it using pip3:
pip3 install scikit-learnIf this doesn’t work, it may be that you have multiple versions of Python 3. In that case run:
python3 -m pip install scikit-learnTrain and evaluate the LogisticRegression model on both datasets and compare the results with your own implementation.
For just the Challenger dataset, create a visualization of both:
Make sure to think about visualization practices discussed in class including:
Submit your figure as part of your GitHub repo using the filename challenger.pdf.
(See README.md to answer these questions)
Are there any differences between your implementation of logistic regression and the sklearn model? How did the sklearn logistic regression model perform on the datasets?
So far, we have run logistic regression and Naive Bayes on different types of datasets. Why is that? Discuss the types of features and labels that we worked with in each case.
Regarding the Challenger data specifically, what was your final probability of an accident after fitting the model? Is this what you expected? Based on this value, would you have recommended the Challenger be launched on 1/28/86? What data and/or modeling might have helped increase the confidence of our prediction?